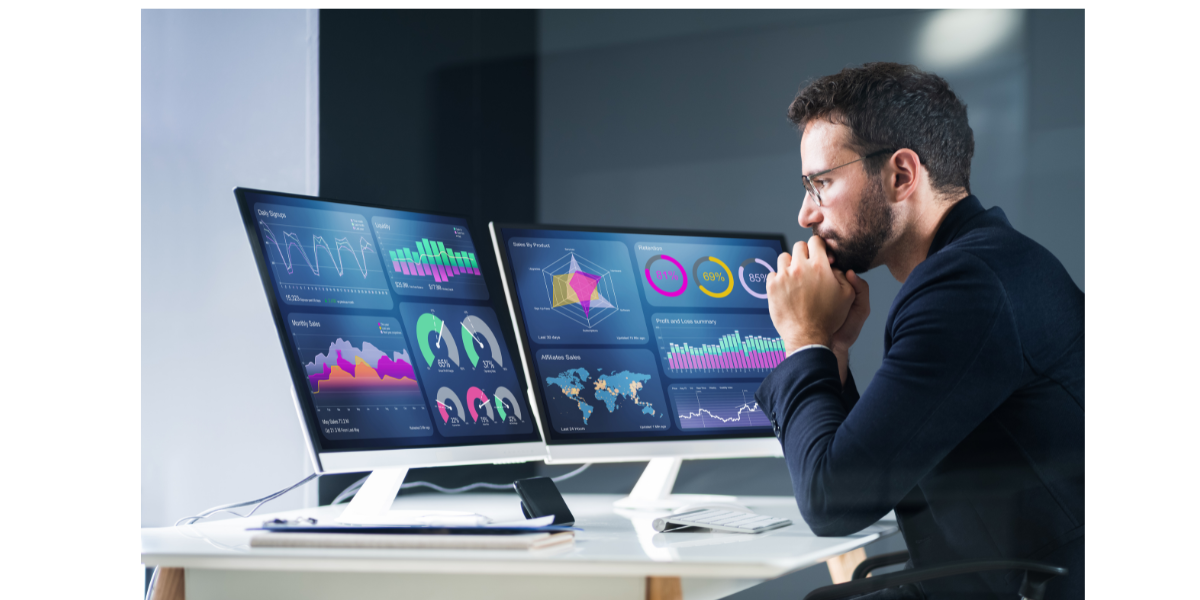
Report and Visualization
Reporting and visualization services are essential for businesses to turn raw data into meaningful, actionable insights.

Report and Visualization
Reporting and visualization services are essential for businesses to convert raw data into clear, actionable insights. By using tools like Power BI, Tableau, and Qlik, companies can create interactive dashboards that highlight trends and key performance indicators in real time. This enables faster, data-driven decision-making and improves communication across teams. Ultimately, these services help businesses stay agile and competitive by providing a comprehensive view of their data landscape.

Report Design and Development
Custom ReportCreation . Template Development . Automated Reporting.
Report and Dashboard Migration
Inventory and Prioritization. Recreation and Redesign. Customization.
CXO Dashboards Service Offerings
KPI Selection.
Visualization Design. Interactivity .
Visualization and Dashboard Design
Interactive Dashboards.
Visual Analytics.
Real-time Monitoring.

What we offer
- Sales & marketing
- Manufacturing and Operations
- Customer 360
- Regulatory KPIs
